Financial information
Find out where our money comes from and how we spend it.
The University delivered an operating deficit of £33.4m in 2024/25 before movements in the pension scheme provisions, specific bad debt provisions and the costs of voluntary severance schemes.
2024/25 saw our total income reduce to £634.7m, down from £649.1m in 2023/24. Our expenditure was £668.1m excluding movements in pension scheme provisions of £2.8m and one off costs of £24.3m related to voluntary severance/redundancy schemes and £2.4m of specific bad debts.

Annual Report and Financial Statements 2025
Year ended 31 July 2025.
If this document cannot be read by your assistive software, you can request an accessible version by emailing web@cardiff.ac.uk. Please include the assistive tools you use and the format you require.
Underlying deficit


| Operating costs | (£m) |
|---|---|
| Expenditure per financial statements | 692.0 |
| Add back movement in pension scheme provisions | 2.8 |
| Deduct voluntary severance scheme costs | (24.3) |
| Underlying operating costs | 668.1 |
| Income per financial statements | 634.7 |
| Underlying deficit | (33.4) |
| Voluntary severance scheme costs | (24.3) |
| Specific provisions | (2.4) |
| Impairment of fixed assets | (1.8) |
| Pension movements | 15.2 |
| Gain on investments | 4.5 |
| Sale of non-current investments | 7.3 |
| Other movements | 0.6 |
| Comprehensive Deficit for the Year | (34.3) |
There was a cash outflow of £12.4m on operating activities and £35m was invested in premises and equipment for staff & students.
Cash and cash equivalents


| Cash and cash equivalents | (£m) |
|---|---|
| Opening cash | 105.8 |
| Operating activities | (12.4) |
| Investment (see below) | (20.6) |
| Financing | 6.1 |
| Closing cash | 78.9 |
Investment

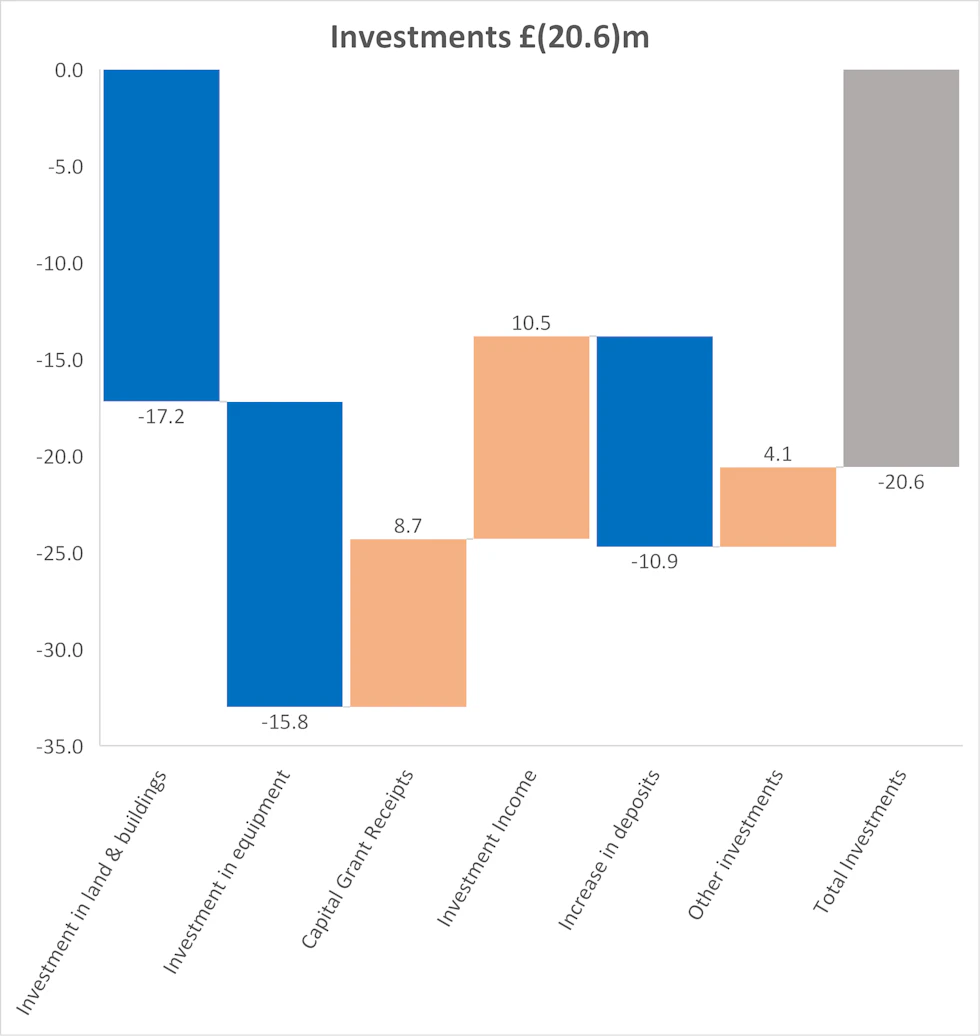
| Investing activities | £m |
|---|---|
| Investment in land and buildings | (17.2) |
| Investment in equipment | (15.8) |
| Capital grant receipts | 8.7 |
| Investment income | 10.5 |
| Decrease in deposits | (10.9) |
| Other investments | 4.1 |
| Total | (20.6) |
Investment in buildings


| Investment in buildings | £m |
|---|---|
| Aberconway Student Community Hub | (0.1) |
| Network Refresh | (0.1) |
Others | (0.2) |
| 50-51 Park Place | (0.2) |
| 42-45 Park Place | (0.4) |
| Queens Reconfiguration | (0.4) |
| Healthcare Relocation | (0.5) |
| Critical Maintenance | (0.6) |
| Student Connect Hubs | (0.8) |
| Building Energy Management System | (1.1) |
| Students Union | (1.7) |
| Student Residences | (4.9) |
| Carbon Reduction Programmes | (6.2) |
| Total | (17.2) |
Investment in equipment

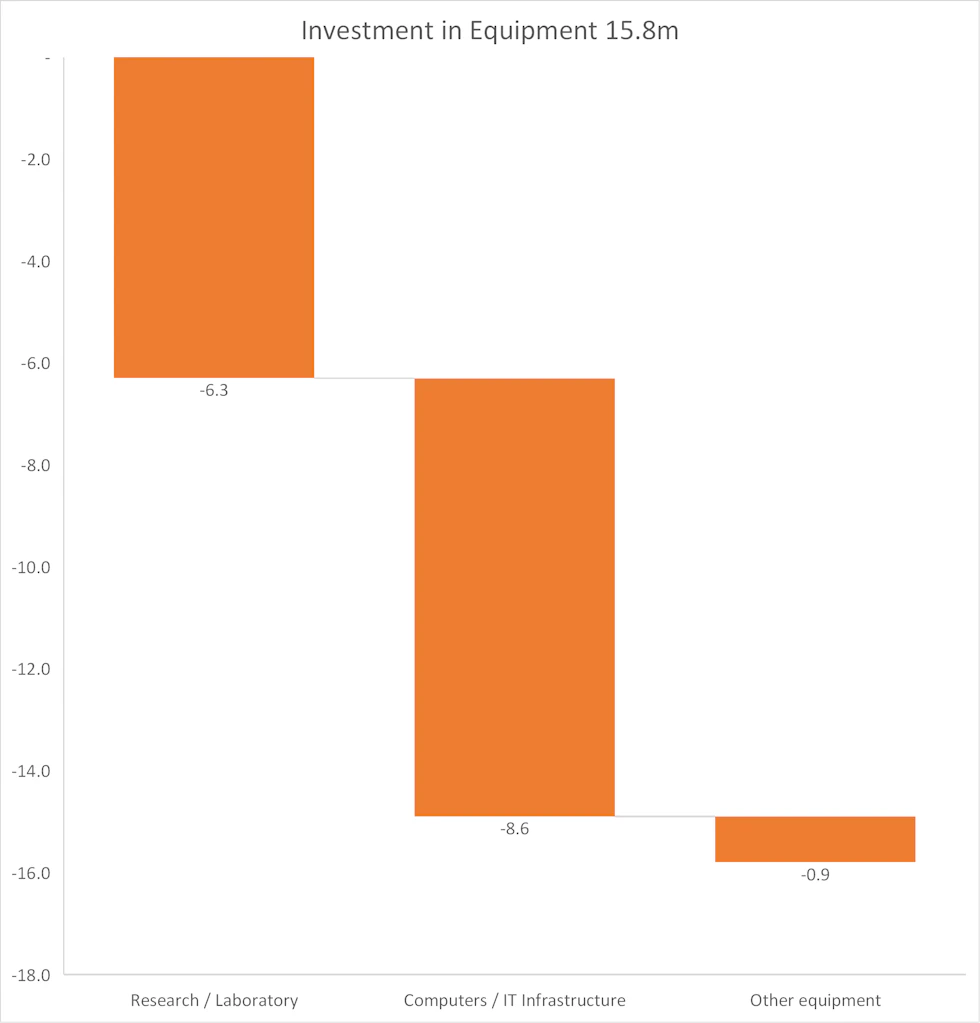
| Investment in equipment | £m |
|---|---|
| Research/Laboratory | (6.3) |
| Computers/IT Infrastructure | (8.6) |
| Other equipment | (0.9) |
| Total | (15.8) |
Like many universities, Cardiff operated in an environment of high inflation, constrained public funding, and international student market volatility. Increased utility and pay costs following Russia’s invasion of Ukraine, have left a lasting impact on our cost base. At the same time we have faced a reduction in international student numbers due to stricter visa rules and global economic uncertainty. This confluence of factors made 2024/25 a challenging year financially for Cardiff University, as it was for many of our peers.
Throughout the year, the University took proactive steps to strengthen its financial resilience. We exercised disciplined budgeting and firm cost control to mitigate inflationary pressures, and we prioritised investments that directly support strategic outcomes. In parallel, longer-term measures were initiated to address the structural deficit, notably through the Academic Futures programme.
Where our money comes from
We received 3% less than last year in tuition fees and education contracts, together with declines in income from funding body grants (0.3%), investment income (10.2%), donations and endowments (66.8%) and other income (4.4%). Offsetting these declines was a 3.5% increase in research income.
Total income


| Total income | £m |
|---|---|
| Tuition fees and education contracts | 317.9 |
| Funding body grants | 83.0 |
| Research grants and contracts | 130.9 |
| Other income | 91.0 |
| Investment income | 10.5 |
| Donations and endowments | 1.4 |
| Total income | 634.7 |
What we spend our money on
In 2024/25, (before movements on pension schemes and voluntary severance scheme costs) we spent £670.5m compared to £680m the previous year. Management enacted strict limits on discretionary expenditure, focusing resources on business-critical areas and strategic priorities.
Staff costs as a proportion of income concluded the year at 59.7% (2023/24: 59.0%) – a stable ratio reflects effective mitigation of pay-related inflation to keep this key ratio stable.
Operating expenses reduced by £4.6m to £230.0m in the year. Non-pay spending was tightly controlled: activities and purchases were restricted to those essential for core operations, student support, and revenue generation. The University also benefited from energy-saving initiatives and efficiency gains in procurement to partially mitigate cost increases. Travel, catering, and other discretionary spend remained low as part of prudent financial management.
During the year, the University made the difficult decision to implement a Voluntary Severance and Voluntary Redundancy Scheme (“Academic Futures” voluntary phase) to help reduce the payroll to a more sustainable level. These schemes resulted in an exceptional cost of £24.3 million in 2024/25. While this one-off expense contributed to the overall deficit, it is a strategic investment in the University’s future financial health. The reduction in staff through voluntary means will generate substantial recurrent savings – £22 million per annum once fully implemented. These savings will improve our expenditure run-rate in subsequent years, supporting Cardiff’s aim to “return the University’s cost base to a position where we can afford to pay for all our activity on a sustainable long-term basis”.
Total activity spend (including specific bad debts of £2.4m)

